Where:
– f(x) is the value of the normal distribution at a given point x
– \sigma is the standard deviation of the distribution
– \mu is the mean of the distribution
The normal distribution, also known as the Gaussian distribution, is a bell-shaped probability distribution that is symmetric around its mean. It is one of the most widely used probability distributions in statistics due to its simple and convenient properties.
1. The normal distribution is characterized by two parameters: the mean (µ) and the standard deviation (σ). The mean determines the center of the distribution, while the standard deviation measures the spread or dispersion of the data around the mean.
2. The normal distribution is symmetric, meaning that the probability of observing a value greater than the mean is the same as the probability of observing a value less than the mean.
3. The shape of the normal distribution is defined by its probability density function, which is given by the formula:
f(x) = \frac{1}{\sigma \sqrt{2\pi}} e^{-\frac{(x - \mu)^2}{2\sigma^2}}
where:
- \mu is the mean of the distribution
- \sigma is the standard deviation
- e is the mathematical constant approximately equal to 2.71828
1. The normal distribution has been extensively studied and used in various fields such as physics, biology, economics, and psychology. In many experimental settings, data often follow a normal distribution due to the central limit theorem.
2. In a classic experiment by Sir Francis Galton, he measured the heights of a large number of people and found that the distribution of heights followed a normal distribution. This led to the development of the concept of the normal curve and provided a foundation for modern statistics.
3. In another experiment, researchers studied the distribution of test scores in a large population. They found that the scores were normally distributed with a mean of 100 and a standard deviation of 15. This information allowed them to make predictions about the proportion of students scoring above or below a certain threshold.
1. The normal distribution is used in hypothesis testing and confidence interval estimation. By assuming that data are normally distributed, researchers can make statistical inferences about population parameters.
2. In finance, the normal distribution is often used to model stock prices and returns. By assuming that stock returns follow a normal distribution, investors can estimate the probability of different outcomes and make informed decisions about their investments.
3. In quality control, the normal distribution is used to assess the variability of a process and determine if it is within acceptable limits. By calculating control limits based on the mean and standard deviation of the data, manufacturers can ensure that their products meet certain quality standards.
The normal distribution is a fundamental concept in statistics that has wide-ranging applications in various fields of study. By understanding the characteristics of the normal distribution and its probability density function, researchers can analyze data, make predictions, and draw meaningful conclusions from their observations. The normal distribution provides a versatile and powerful tool for statistical analysis and inference.
A standardized test has a mean score of 100 and a standard deviation of 15. If the scores are normally distributed, find the probability of a randomly selected student scoring above 120.
Let X be the random variable representing the test scores. Since the scores are normally distributed, we can standardize the scores using the z-score formula:
Z = \frac{X - \mu}{\sigma}
where \mu = 100 and \sigma = 15.
For X = 120:
Z = \frac{120 - 100}{15} = \frac{20}{15} = \frac{4}{3}.
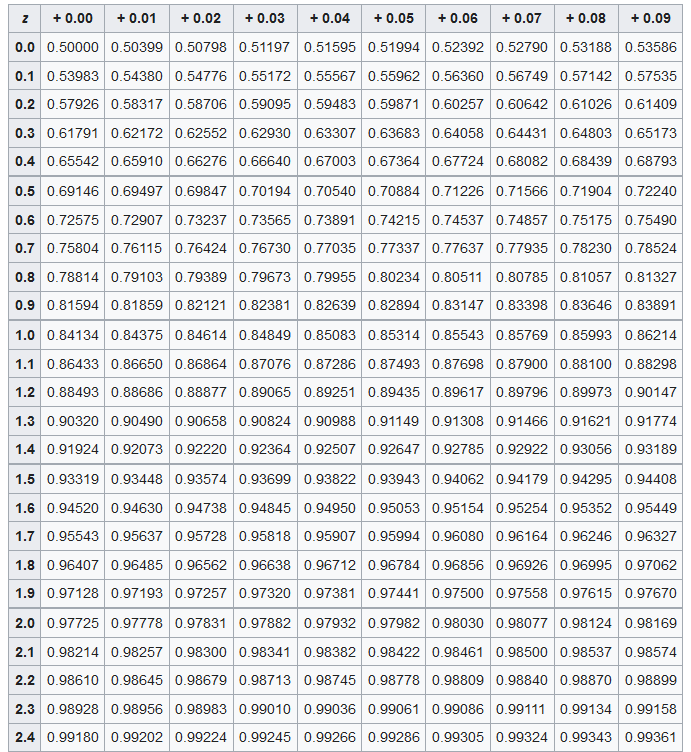
Using a standard normal distribution table, we find that the probability of a z-score being larger than \frac{4}{3} is approximately 0.0918. Therefore, the probability of a randomly selected student scoring above 120 is 0.0918.
The heights of a certain population of trees are normally distributed with a mean of 65 feet and a standard deviation of 5 feet. Find the percentage of trees that have heights between
60 and 70 feet.
Solution:
Let X represent the height of a randomly selected tree. We want to find P(60 < X < 70). We can standardize the values using the z-score formula:
For X = 60:
Z_1 = \frac{60 - 65}{5} = -1
For X = 70:
Z_2 = \frac{70 - 65}{5} = 1
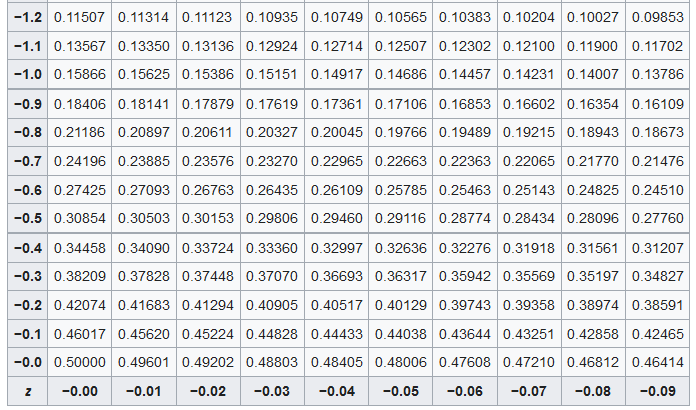
Using a standard normal distribution table, we find that P(-1 < Z < 1) is approximately 0.6827. Therefore, approximately 68.27%\ of the trees have heights between 60 and 70 feet.
The weights of apples in a certain orchard are normally distributed with a mean of 150 grams and a standard deviation of 20 grams. What is the minimum weight that must be exceeded by the heaviest 20% of apples?
Solution:
Let X represent the weight of an apple. We want to find the weight that corresponds to the 80^{th}\ percentile. We can standardize the value using the z-score formula and the standard normal distribution table:
For P(Z < z) = 0.8, we find that z \approx 0.845.
Then, we solve for the weight X:
0.845 = \frac{X - 150}{20}
X = 16.9 + 150 = 166.9
Therefore, the minimum weight that must be exceeded by the heaviest 20% of apples is 166.9 grams.
The diameters of screws produced by a factory are normally distributed with a mean of 8 millimeters and a standard deviation of 0.2 millimeters. What percentage of screws have a diameter less than 7.5\ millimeters?
Solution:
Let X represent the diameter of a screw. We want to find P(X < 7.5). We can standardize the value using the z-score formula:
Z = \frac{7.5 - 8}{0.2} = -2.5
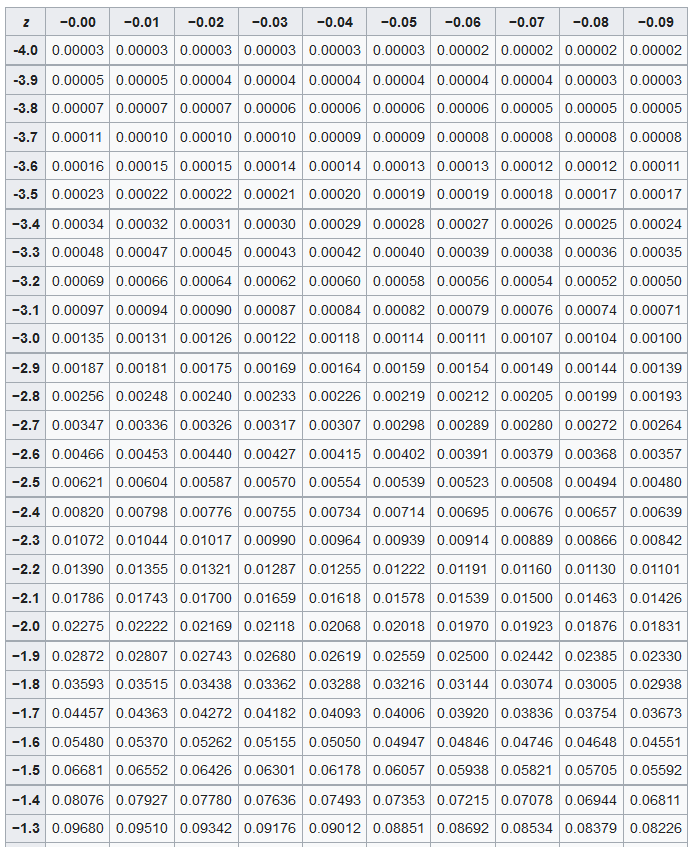
We find that the percentage of screws with diameters less than 7.5 millimeters is the same as the probability of Z < -2.5, which is approximately 0.0062 or 0.62%\.
The monthly electricity bills of a residential area are normally distributed with a mean of $100 and a standard deviation of $15. What is the probability that a randomly selected household has a bill less than $90?
Solution:
Let X represent the monthly electricity bill. We want to find P(X < 90). We can standardize the value using the z-score formula:
Z = \frac{90 - 100}{15} = -0.67
The probability that a randomly selected household has a bill less than $90 is the same as the probability of Z < -0.67, which is approximately 0.2514.
Therefore, the probability is 0.2514 or 25.14%\.
1. Find the probability that a random variable following a normal distribution with a mean of 10 and standard deviation of 2 is less than 12.
2. Calculate the z-score for a value of 15 in a normal distribution with a mean of 10 and standard deviation of 3.
3. What is the standard deviation of a normal distribution with a mean of 20 and a variance of 36?
4. Determine the 90th percentile of a normal distribution with a mean of 50 and standard deviation of 5.
5. If a random variable follows a normal distribution with a mean of 25 and standard deviation of 4, find the probability that it is greater than 30.
6. Calculate the z-score for a value that is at the 70th percentile in a normal distribution with a mean of 100 and standard deviation of 15.
7. What is the area under the normal curve between z-scores of -1.5 and 1.5?
8. Determine the standard deviation of a normal distribution with a mean of 75 and variance of 100.
9. If a random variable follows a normal distribution with a mean of 40 and standard deviation of 8, find the probability that it is between 35 and 45.
10. Find the z-score for the 95th percentile in a normal distribution with a mean of 60 and standard deviation of 10.
11. Calculate the mean of a normal distribution with a variance of 25 and standard deviation of 5.
12. Determine the probability that a random variable following a normal distribution with a mean of 30 and standard deviation of 6 is greater than 40.
13. What is the z-score for a value that is at the 80th percentile in a normal distribution with a mean of 50 and standard deviation of 5.
14. Find the area under the normal curve between z-scores of -2 and 2.
15. If a random variable follows a normal distribution with a variance of 36 and standard deviation of 6, find the probability that it is less than 24.
1. 0.8413
2. 1.6667
3. 6
4. 55.77
5. 0.1587
6. 1
7. 0.8664
8. 10
9. 0.6827
10. 1.645
11. 0
12. 0.0228
13. 0.8416
14. 0.9545
15. 0.1587